TopicId174
The graph displays the shift of the patient's center of gravity (or barycenter) over the photo acquired.
Example:
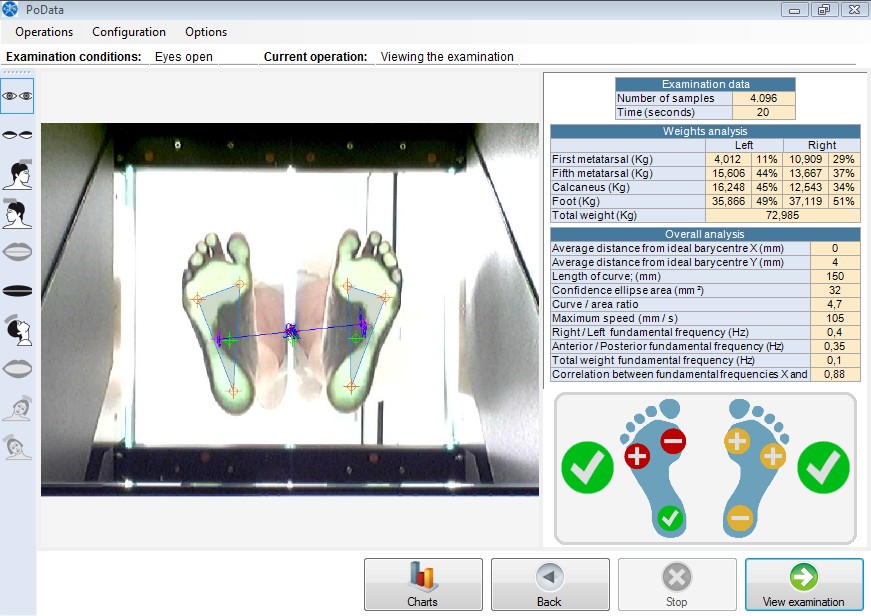
Curves of the barycenters
The image displays three curves, which refer to:
The three curves are blue and represent the shift of the patient's center of gravity during the test.
You can also have a dynamic view of the center of gravity shift via the View examination button, see view examination.
Points on the image
Points on the image are color-coded:
Ideal barycenters are displayed in green and their position is calculated according to the position of virtual sensors and an ideal load of an ideal patient, with the following distribution:
See also Numeric values.