TopicId175
Numeric values are calculated after a test and can be divided into three groups:
Example:
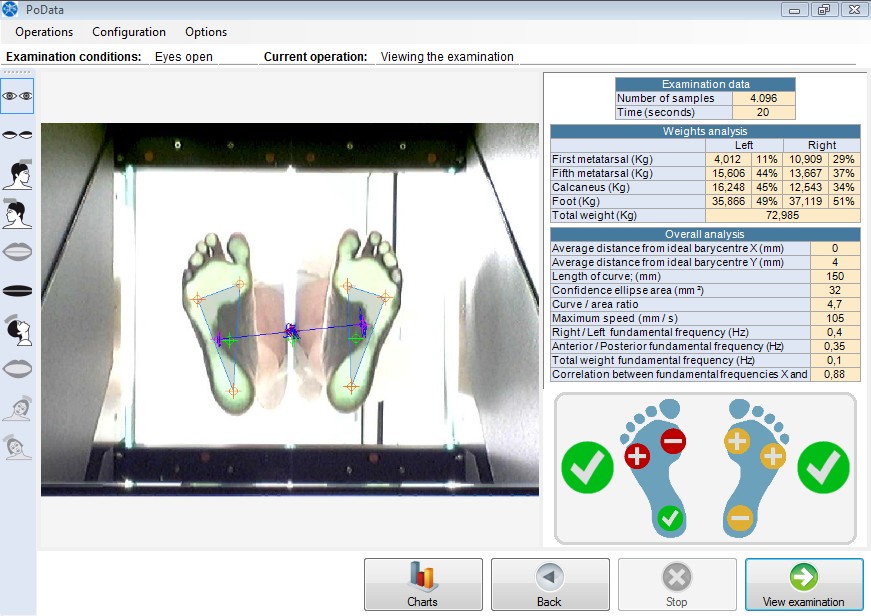
Examination data
These are the general data of the test.
Number of samples
It is the number of samples performed during the test over a period of time.
Time (seconds)
It is the test duration expressed in seconds.
Weights analysis
These are the data concerning the patient's average weights on the six virtual sensors.
By "average weight" we mean the average of the weight recorded during the 20-second examination.
The weights analysis table shows the weight, which is expressed in kilograms, and a percentage of the weight in relation to total weight.
Weights on the right and left foot are shown separately, while the last row indicates the patient's total weight.
First metatarsal
Displays the weight on the first metatarsal in kilograms and the weight percentage in relation to total weight.
Data for the right and left foot are shown separately.
Fifth metatarsal
Displays the weight on the fifth metatarsal in kilograms and the weight percentage in relation to total weight.
Data for the right and left foot are shown separately.
Calcaneus
Displays the weight on the calcaneus in kilograms and the weight percentage in relation to total weight.
Data for the right and left foot are shown separately.
Foot
Displays the weight on the foot in kilograms and the weight percentage in relation to total weight.
The weight on the foot is given by the sum of the weights on the virtual sensors.
Data for the right and left foot are shown separately.
Total weight
Displays the patient's total weight in kilograms.
The total weight is given by the sum of the weights on the two feet, or by the sum of the weights on the 6 virtual sensors.
Total weight can vary during the examination, depending on the patient's mass inertia over small oscillations along the vertical axis.
Overall analysis
These are the data, measurements and overall analyses concerning the test.
Average distance from the ideal center on the X-axis (mm)
To obtain this measurement, linear calibration must have been carried out.
It is the distance in millimeters on the X-axis (left / right axis) as to the patient's ideal barycenter.
In other words, it is a value indicating the distance between the patient's average center of the gravity on the right / left axis and the ideal barycenter.
Average distance from the ideal center on the Y-axis (mm)
To obtain this measurement, linear calibration must have been carried out.
It is the distance in millimeters on the Y-axis (anterior / posterior axis) as to the patient's ideal barycenter.
In other words, it is a value indicating the distance between the patient's average center of the gravity on the anterior / posterior axis and the ideal barycenter.
Length of curve (mm)
To obtain this measurement, linear calibration must have been carried out.
It is the length in millimeters of the patient's center of gravity shift during the test.
Confidence ellipse area at 90% (mm²)
To obtain this measurement, linear calibration must have been carried out.
It is the area in mm² of the ellipse that includes all the center of gravity points measured and transferred on a system of Cartesian axes with a confidence level of 90%.
A 90% confidence refers to a statistical calculation meant to exclude extreme shifts of the center of gravity from the area calculation.
To obtain this measurement, linear calibration must have been carried out.
It is the ratio between the curve length and the confidence ellipse area at 90%
See also Considerations on length relationship curve / area.
Maximum speed (mm/s)
To obtain this measurement, linear calibration must have been carried out.
It is the average center of gravity shifting maximum speed in millimeters per second.
Right / Left fundamental frequency (Hz)
It is the fundamental frequency of the right / left oscillation in Hertz.
See fundamental frequency in FFT Graphs.
Anterior / Posterior fundamental frequency (Hz)
It is the fundamental frequency of the anterior / posterior oscillation in Hertz.
See fundamental frequency in FFT Graphs.
Total weight fundamental frequency (Hz)
It is the oscillation fundamental frequency of total weight in Hertz.
Total weight can vary during the examination, depending on the patient's mass inertia over small oscillations along the vertical axis.
See fundamental frequency in FFT Graphs.
Correlation between fundamental frequencies X and Y
It is the absolute value of the ratio between the fundamental frequency X and the fundamental frequency Y.
The fundamental frequency X is the fundamental frequency of oscillation in the right and left direction.
The fundamental frequency Y is the fundamental frequency of oscillation in the anteroposterior direction.