TopicId090
The graphs window displays the result of the decomposition of oscillation frequencies.
The graphs can be selected on the upper bar of the window and are as follows:
FFT
FFT stands for Fast Fourier Transform.
In the specific case of PoData, FFT allows decomposing the oscillations of the patient into components of frequencies and amplitudes.
The decomposition is performed on the two axes and the vertical axis:
FFT Graphs
FFT graphs display the amplitudes on the Y-axis and the frequencies on the X-axis.
Frequencies are plotted on a natural logarithmic scale.
Example of FFT graph for the frequencies of right / left oscillation:
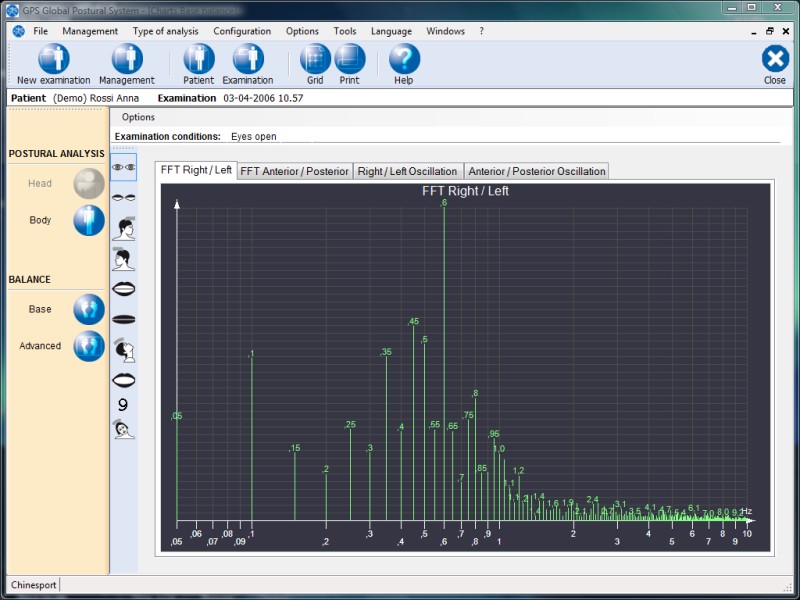
It is the frequency with the largest amplitude; in the example, the oscillation frequency in the right / left direction with the largest amplitude has a value of 0.4 Hertz.
See also: numeric values.