TopicId118
The normal parameters graph, shown in the lower right area of the window, is made up of the stylised symbol for the feet and some indicators.
Example:
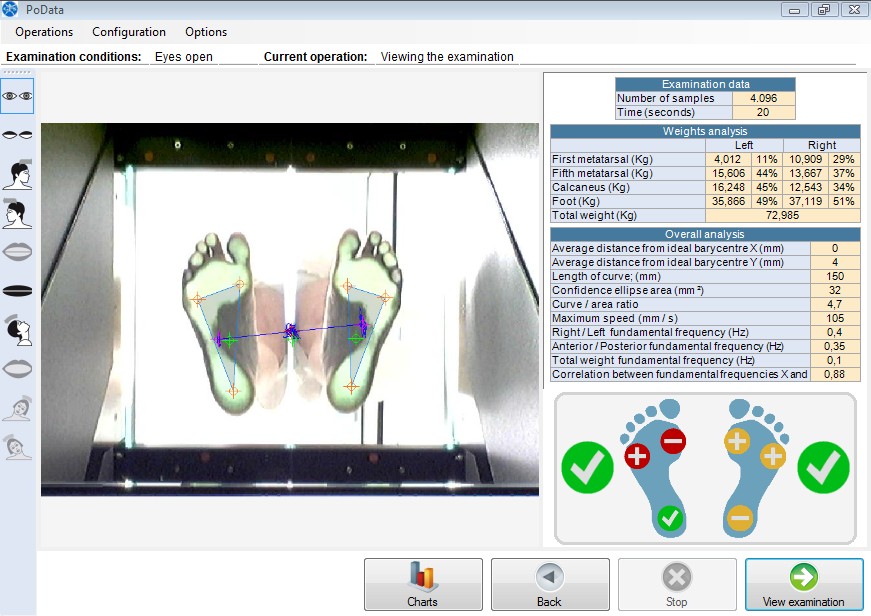
Description of the graphic indicators
There are 8 graphic indicators in all, 4 for each foot.
The 2 largest indicators relate to the total for each foot, while the other 6 smaller indicators relate to the 3 specific points on each foot.
Each indicator can have the following values:
Symbol |
Percentage value |
Description |
|
15 <= X <= 85 |
The value measured is within the normal range. |
|
85 < X <= 97 |
The value measured is slightly higher than the normal range. |
|
3 <= X < 15 |
The value measured is slightly lower than the normal range. |
|
97 < X <= 100 |
The value measured is much higher than the normal range. |
|
0 <= X <3 |
The value measured is much lower than the normal range. |
Meaning of the normal range of values
The normal range of values means the normal range taken from statistical studies carried out on a representative sample of the population.
For more information, see the reports on these scientific studies: