TopicId134
The graph displays the shift of the patient's center of gravity on a system of Cartesian axes.
Example:
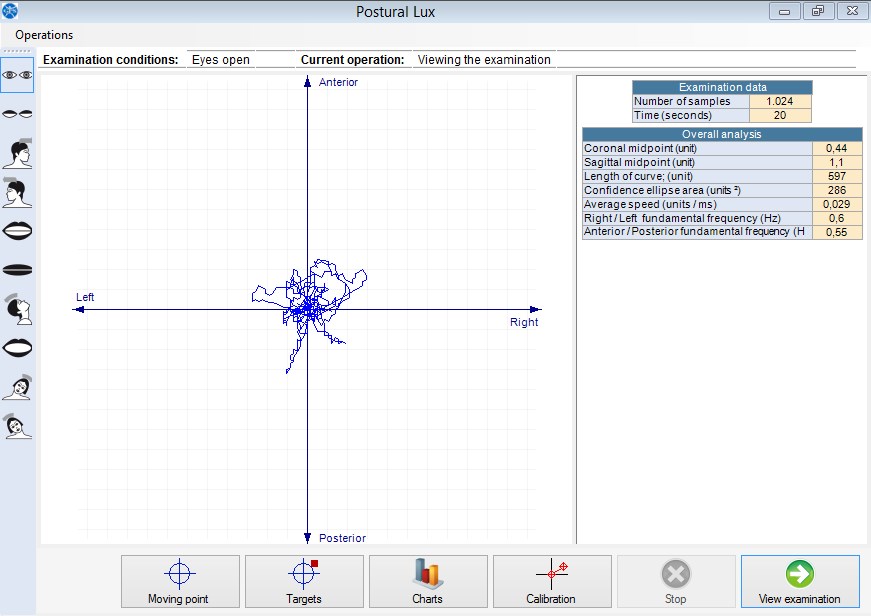
The graph values are expressed in units.
The View examination button performs a test simulation, displaying the shift of the patient's center of gravity over time and the creation of the graph.
See also Numeric values.